How to Read a Company Earnings Report: A Step-by-Step Guide for New Investors
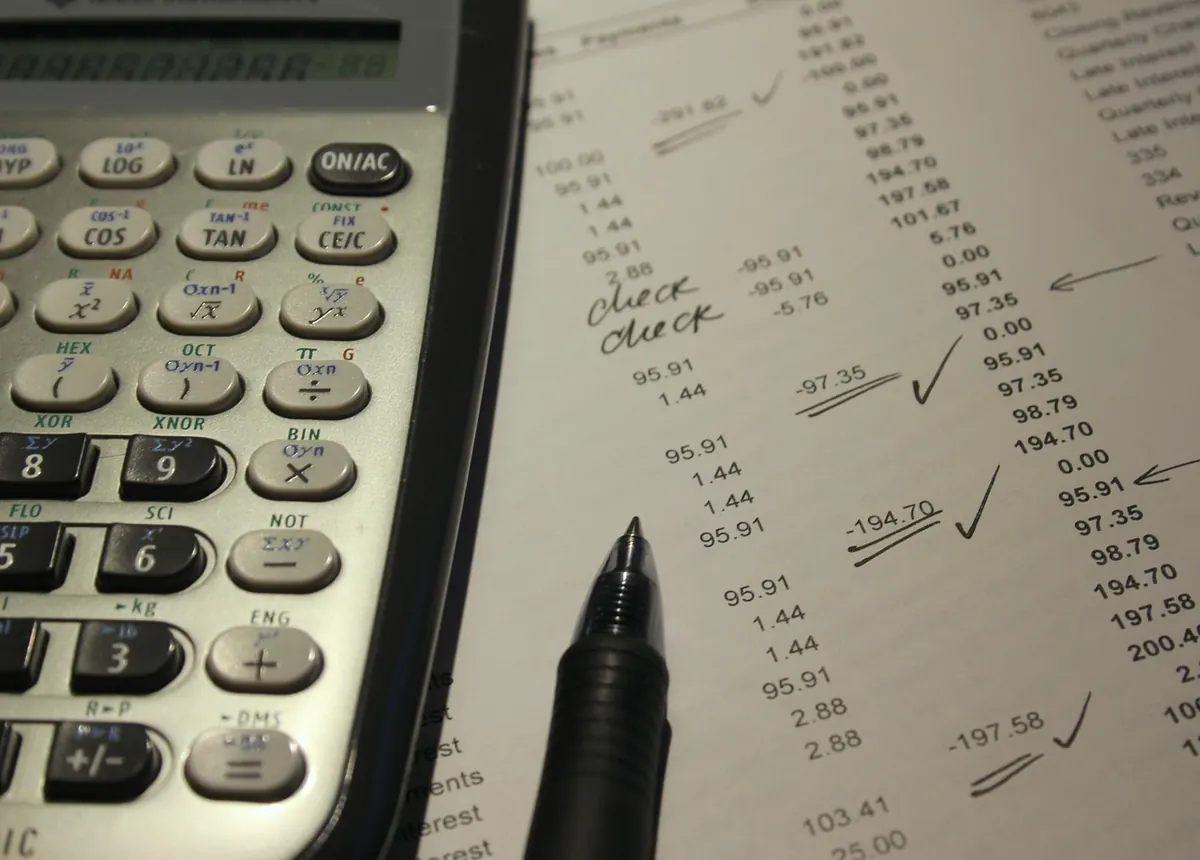
A quarterly earnings report can run past a hundred pages once you count the footnotes, and the glossy press release on page one is written by people who want you to feel good about the numbers. That is fine. Your job is not to read all of it — it is to read the right parts in the right order, so that fifteen minutes of attention tells you whether the company's story is holding together. The good news is that three statements carry most of the weight: the income statement, the balance sheet, and the cash flow statement. Learn what each one is for, and the report stops being a wall of figures and starts reading like a set of cross-checks.
Start With the Income Statement
The income statement answers a single question: over this period, did the business sell more than it spent? It reads from the top down, and each line narrows the picture.
Revenue and growth
Look at revenue first, but compare it with the same quarter a year earlier, not just the previous quarter. Most businesses have a seasonal rhythm, and a retailer that looks flat against December may be having an excellent March. Pull the last four to eight quarters into a spreadsheet if you can. You want to see whether growth is steady, accelerating, or quietly fading.
Margins, not just profit
Gross profit is revenue minus the cost of producing what was sold. Divide gross profit by revenue and you have gross margin — a compact measure of pricing power. Suppose revenue rises 20% while gross margin slips from 40% to 37%. The business is bigger but less profitable per sale, and you should ask why: discounting, higher input costs, a shift toward cheaper products? Operating margin, after sales, marketing and administrative costs, tells you how much the core business keeps before interest and tax.
Earnings per share and one-offs
Net income divided by the diluted share count gives earnings per share. Check that diluted count: if it has grown a lot, profit per share is being spread thinner. Then scan for unusual items — restructuring charges, impairments, gains on a property sale, an unusually low tax rate. A single charge is not automatically bad. The same charge appearing in four consecutive quarters is a pattern, not a one-off.
The Balance Sheet: What the Company Owns and Owes
The balance sheet is a snapshot taken on the last day of the period. Assets equal liabilities plus shareholders' equity, which means every number you look at has a counterpart somewhere else.
Start with cash and debt. Total debt includes bonds, bank loans and, importantly, lease obligations that some companies report separately. Subtract cash and you have net debt. Compare net debt with the company's annual operating profit: a business carrying four or five times its yearly operating profit in net debt has far less room to manoeuvre than one carrying less than one times.
Then look at working capital — receivables and inventory against payables. If receivables are growing faster than revenue, the company may be selling to customers who pay slowly, or pushing product into the channel to hit targets. Inventory rising faster than sales has the same smell. Both are early warnings that show up before profit does.
The Cash Flow Statement: Where the Money Actually Went
Profit is an accounting figure; cash is what pays the bills. The cash flow statement splits into three sections: operating, investing and financing. Operating cash flow is the one to read first, because it is hard to dress up for long. Compare it with net income over several years. They will rarely match exactly, but they should trend in the same direction.
Next, subtract capital expenditure from operating cash flow and you have free cash flow — the money left for dividends, buybacks, debt repayment or reinvestment. Watch also for large add-backs of stock-based compensation, which inflate operating cash flow while quietly diluting shareholders, and for financing that relies on new borrowing or new shares just to keep the lights on.
Red Flags to Check First
No single warning is proof of trouble, but several together deserve a closer look or a pass. Check these early:
- Profit up, cash flow down. Rising net income with falling operating cash flow over two or three periods is the classic mismatch.
- Receivables or inventory outrunning sales. A sign that growth may be bought with generous terms rather than earned.
- Margins eroding without explanation. Management should say why; silence is information too.
- Debt climbing while profits stall. Interest costs bite hardest when earnings are weakest.
- Recurring "one-time" charges. If they happen every year, treat them as a cost of doing business.
- Goodwill that keeps getting written down. Repeated impairments suggest the company overpaid for acquisitions.
- Late filings, auditor changes or restated accounts. Rare, serious, and worth taking at face value.
- Guidance quietly withdrawn. Not fatal, but it usually means visibility has deteriorated.
Build a Reading Routine
Reports are easier to absorb in a fixed order. This one takes about twenty minutes once you are used to it:
- Read the headline figures and compare them with the same quarter last year and with the company's own guidance.
- Work down the income statement, noting revenue growth, gross margin and operating margin.
- Check cash and net debt on the balance sheet, then working capital trends.
- Compare operating cash flow with net income and calculate free cash flow.
- Skim the segment breakdown to see which part of the business is driving results.
- Read management's commentary, then the risk factors and accounting-policy notes.
- Write two sentences: what changed this quarter, and what you would need to see next quarter to stay comfortable.
That last step matters more than it sounds. Written notes from three quarters ago are the closest thing most investors have to an honest memory.
Your First Pass, and a Sensible Caveat
You do not need to understand every footnote to judge whether a business is improving. Focus on the handful of figures that drive the story — revenue growth, margins, cash conversion, debt — and check them quarter after quarter. Consistency is the reward you are looking for: numbers that move for stated reasons, and management that explains the bad quarters as clearly as the good ones.
One caution worth stating plainly: an earnings report tells you how a company performed, not what its shares are worth. Valuation, competitive threats and your own time horizon sit outside the document. If you are investing money you cannot comfortably afford to lose, or the decision is large relative to your savings, speak to a licensed financial adviser before acting. Reading reports well is a skill that compounds; treat each one as practice, and the tenth will feel very different from the first.
Photo: 777546 / Pixabay